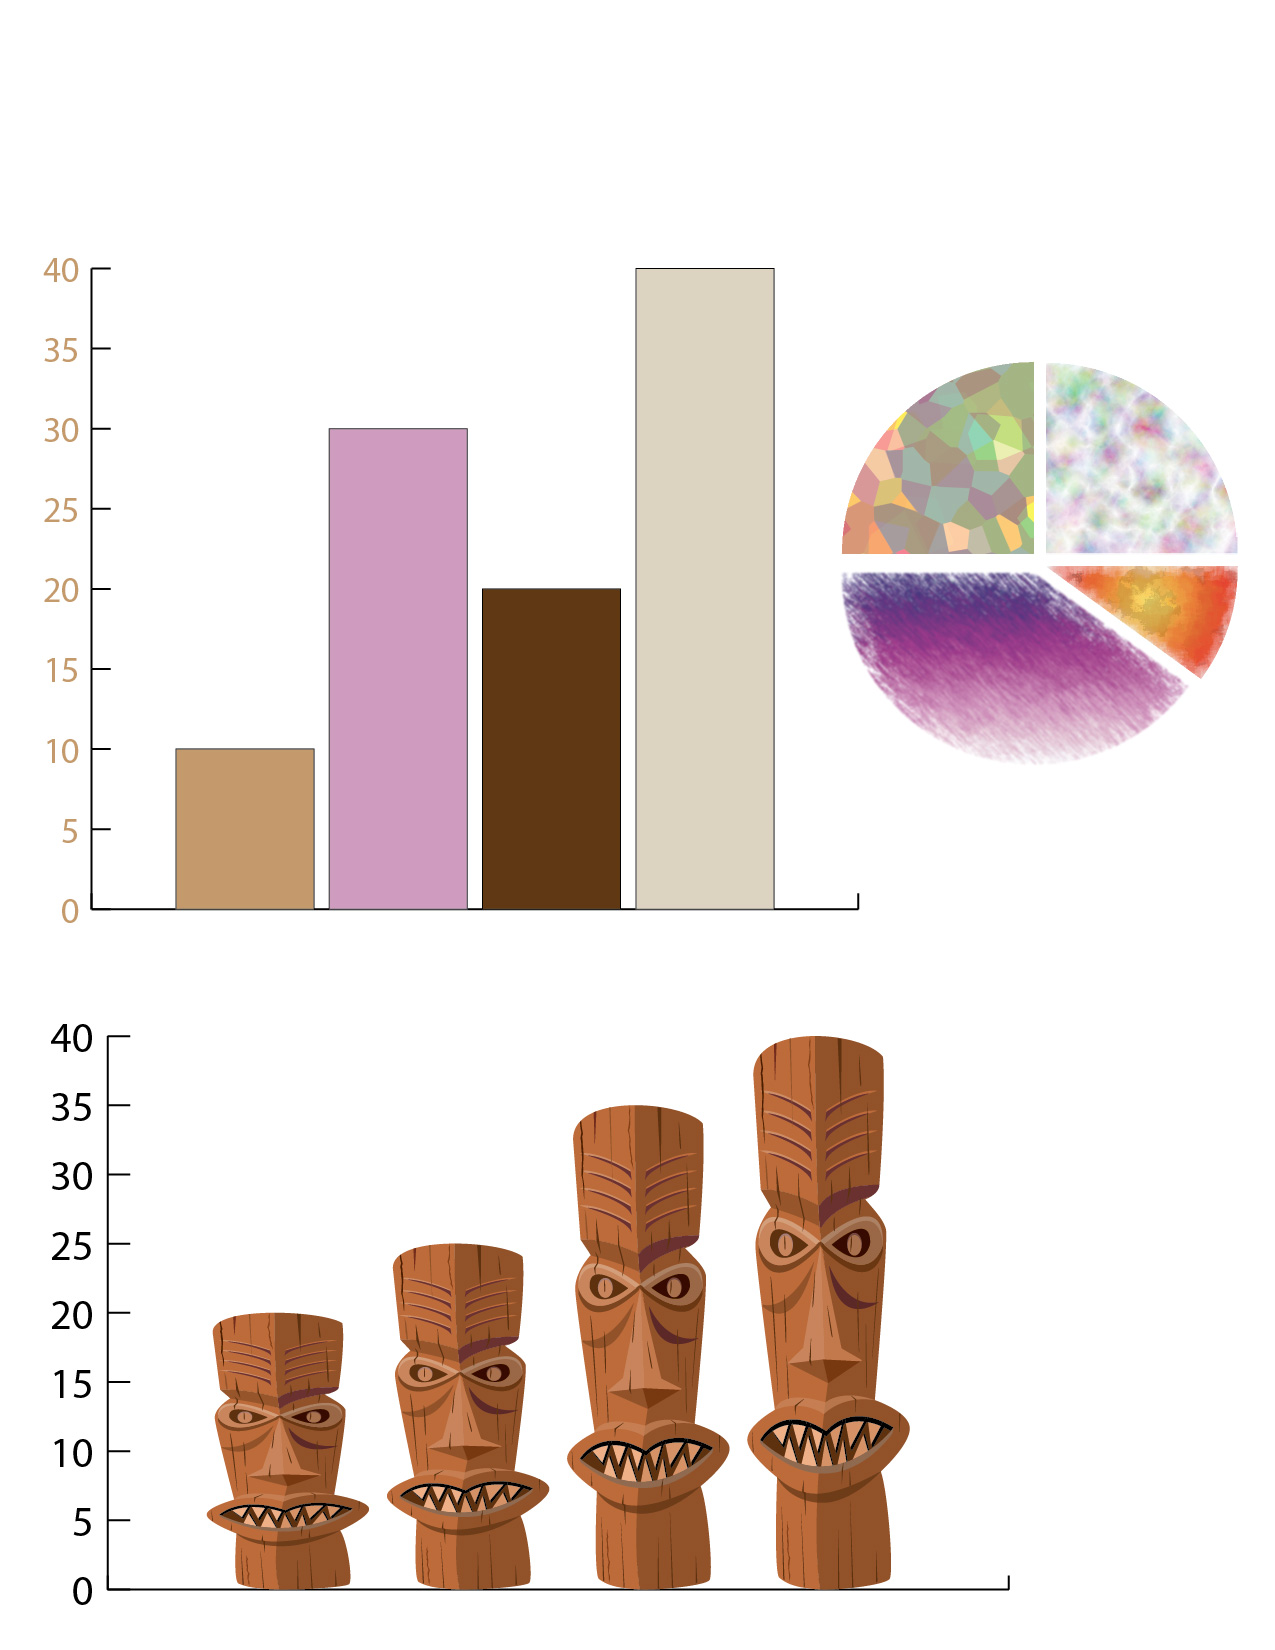
Column Graph
- Select “Graphs” > “Column Graph”
- Enter numbers and press tab after each number is entered, then click the check mark to form the graph
- The numbers on the graph can be changed by going to “Object” > “Graph” > “Data”
- The colors of each column can be changed by direct selecting each column and using the swatches menu to choose colors
Pie Chart
- Select “Graphs” > “Pie Chart”
- Enter numbers and press tab after each number is entered, then click the check mark to form the graph
- To color each section of the chart, go to “Object” > “Expand” and then “Object” > “Ungroup”
- Then go to “Window” > “Graphic Styles” to find different options for fill patterns and designs
Tiki Column Graph
- Go to “Symbols” and select “Tiki,” then drag the symbol you want on to the artboard
- With the symbol selected, go to “Object” > “Graph” > “Design” > “New Design”
- Create a new column graph
- Select graph and go to “Object” > “Graph” > “Column” then select the symbol you originally selected
- The symbols will appear as the columns on the graph!
Published
